reports.view (view all report tabs and data) and
reports.export (download report data for external use).
Users without the reports.view permission will not see the Reports item in the sidebar and cannot access the reports endpoints.
About Reports
The Reports page provides a comprehensive, read-only dashboard for church administrators to monitor the health and activity of their congregation. It is organized into five tabs, each focusing on a different area of your church data.
How Tabs Work
Report tabs use lazy loading — data is only fetched from the server when you click on a tab for the first time. This keeps the initial page load fast even when the database contains thousands of records. Once a tab's data is loaded, switching back to it does not trigger a new request.
Membership Overview
High-level statistics on people, families, departments, and groups.
People & Contacts
Contact coverage rates and profile completeness metrics with visual progress bars.
Attendance
Monthly check-in trends, top events by headcount, and small group meeting summaries.
Events & Registrations
Event counts, registration leaders, and a snapshot of upcoming events.
Data Quality
Automated checklist of 11 data issues with color-coded severity badges and drill-down links.
Membership Overview Admin
The Membership Overview is the default tab shown when the Reports page loads. It provides a bird's-eye view of your church's organizational structure through stat cards, department breakdowns, and group health indicators.
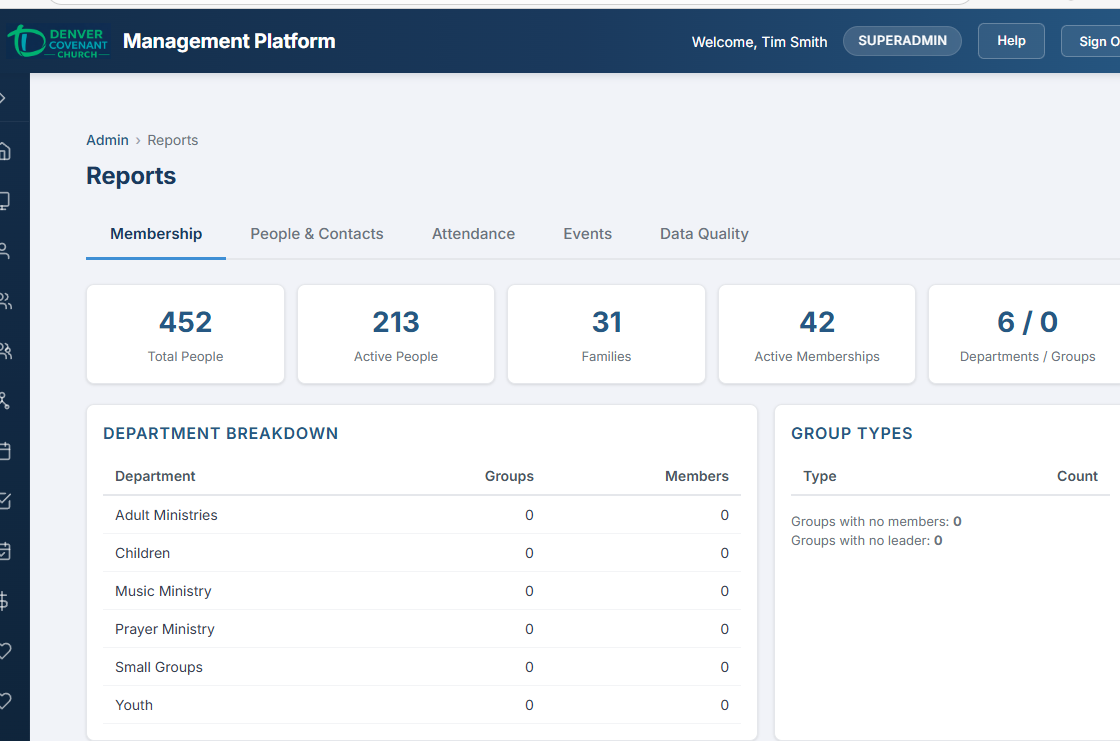
The Membership Overview tab — stat cards across the top, department breakdown on the left, group types on the right.
Stat Cards
Six summary statistics are displayed across the top of the tab:
| Stat Card | Description |
|---|---|
| Total People | Count of all person records in the database (active and inactive) |
| Active People | People with is_active = true |
| Families | Total number of family records |
| Active Memberships | Total active group membership records across all church groups |
| Departments / Groups | Count of top-level departments and their child groups, shown as a combined figure |
Department Breakdown Table
Below the stat cards, a table lists every department with two numeric columns:
| Column | Description |
|---|---|
| Department | Name of the top-level department (group level = 2) |
| Groups | Number of child groups under this department |
| Members | Total active membership count across all groups in the department |
Group Type Breakdown Table
A companion table summarizes groups by their type classification:
| Column | Description |
|---|---|
| Type | The group type name (e.g., Ministry Team, Committee, Class) |
| Count | Number of groups assigned to this type |
Group Health Indicators
At the bottom of the Group Types panel, two additional metrics are shown:
- Groups with no members — Groups that exist but have zero active memberships. These may be defunct or need attention.
- Groups with no leader — Groups that have members but no assigned leader. Leadership gaps can affect group communication and reporting.
People & Contacts Admin
The People & Contacts tab helps administrators understand how reachable the congregation is by measuring contact information coverage and profile completeness across all person records.
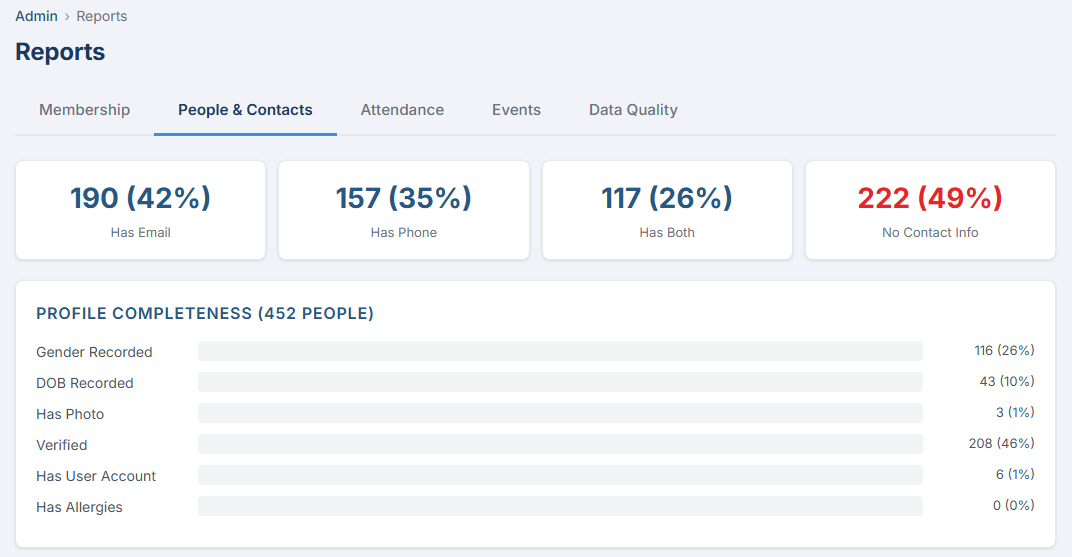
The People & Contacts tab — contact coverage stat cards and profile completeness progress bars.
Contact Coverage Stat Cards
Four stat cards summarize contact information availability. Each card shows both a count and a percentage of total people.
| Stat Card | Description |
|---|---|
| Has Email | People with at least one email address in person_emails |
| Has Phone | People with at least one phone number in person_phones |
| Has Both | People with at least one email AND at least one phone |
| Has Neither | People with no email and no phone — shown in red to highlight unreachable records |
Profile Completeness
Below the stat cards, a profile completeness section shows six metrics as colored progress bars. Each bar represents the percentage of total people who have the given attribute filled in.
Color Coding
| Color | Threshold | Meaning |
|---|---|---|
| Green | Greater than 50% | Healthy — most records have this field filled in |
| Orange | 50% or less | Needs attention — a significant portion of records are missing this data |
Attendance Admin
The Attendance tab provides a year-over-year view of check-in activity, event attendance headcounts, and small group meeting summaries. It is the only report tab with an interactive filter — a year picker that reloads data when changed.
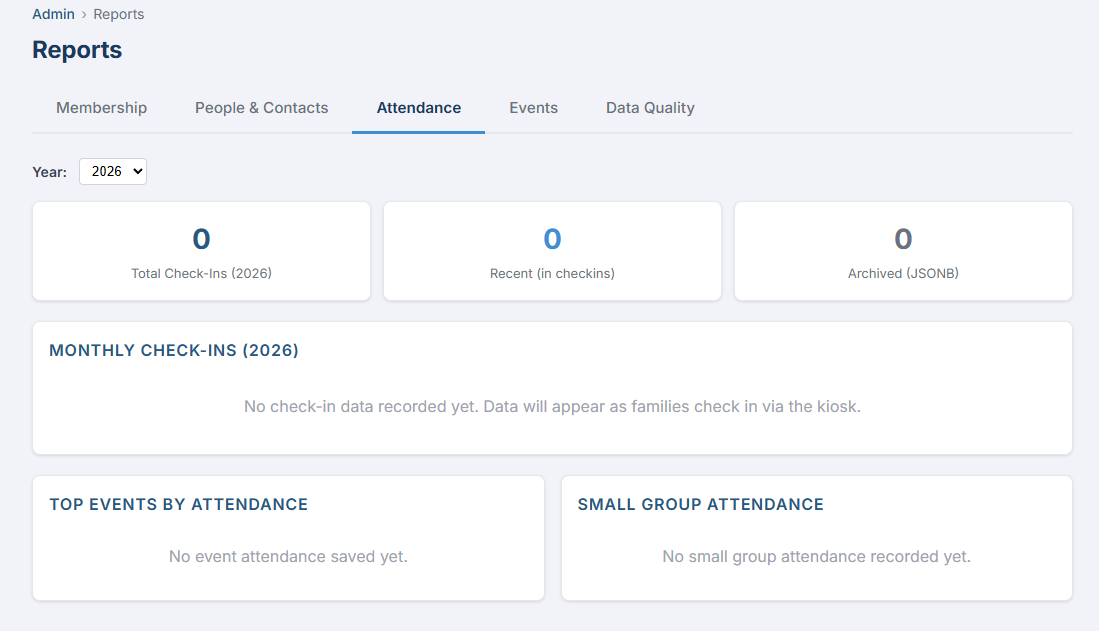
The Attendance tab — monthly check-in bar chart, top events by headcount, and small group meeting summaries.
Year Picker
A dropdown at the top of the tab allows you to select which year to report on. It defaults to the current year and offers the previous year and next year as options. Changing the year triggers a fresh data fetch from the server.
Stat Cards
Three stat cards summarize check-in totals for the selected year:
| Stat Card | Description |
|---|---|
| Total Check-Ins | Combined count of all check-in records for the selected year (both recent and archived) |
| Recent (in checkins) | Check-ins still stored in the live checkins table |
| Archived (JSONB) | Check-ins that have been moved to the JSONB archival format in attendance tables |
Monthly Check-In Totals
A 12-row table shows one row per month (January through December). Each row displays the month name, the check-in count, and a proportional bar chart where the widest bar represents the month with the highest count. If no check-in data exists for the selected year, a placeholder message is shown instead of the table.
| Column | Description |
|---|---|
| Month | Calendar month name (January through December) |
| Check-Ins | Number of check-in records for that month |
| Bar | Visual proportional bar — scaled relative to the highest month |
Top Events by Attendance
A ranked table of the top 10 events by headcount, sourced from the JSONB archival attendance data (event_attendance table). This captures attendance that has been recorded and archived through the check-in system.
| Column | Description |
|---|---|
| Event | Event name |
| Location | Location where the event was held (or dash if not set) |
| Attendees | Total headcount from the archived attendance record |
Small Group Attendance Summaries
A companion table shows attendance patterns across small groups. Each row represents one small group with summary statistics calculated from small_group_attendance records.
| Column | Description |
|---|---|
| Group | Small group name |
| Meetings | Total number of recorded meetings |
| Avg | Average number of attendees per meeting (one decimal place) |
| Last | Date of the most recent meeting (or dash if none recorded) |
Events & Registrations Admin
The Events & Registrations tab provides a quick snapshot of event activity and how effectively events are driving registrations.
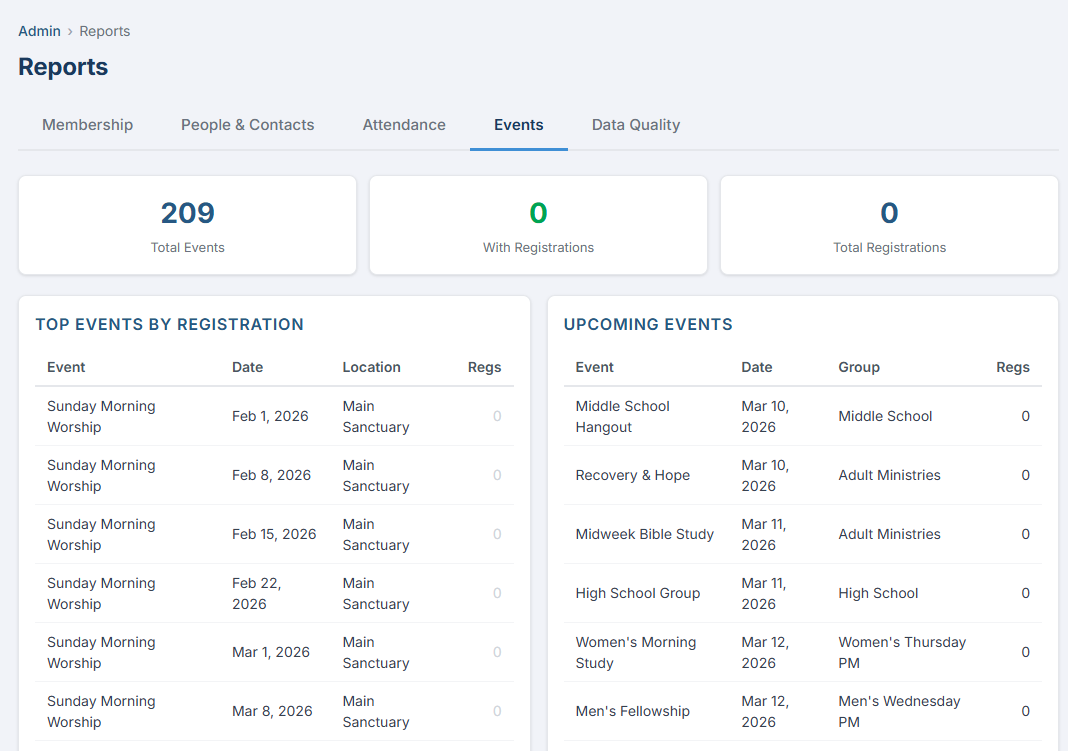
The Events & Registrations tab — stat cards for event counts and a ranked table of top events by registration.
Stat Cards
Three stat cards are displayed across the top:
| Stat Card | Description |
|---|---|
| Total Events | Count of all event records in the system |
| With Registrations | Events that have at least one registration — shown in green |
| Total Registrations | Sum of all registration records across all events |
Top Events by Registration
A table listing the top 15 events ranked by registration count. This helps identify which events generate the most engagement.
| Column | Description |
|---|---|
| Event | Event name |
| Date | Event start date, formatted as "Mon DD, YYYY" |
| Location | Event location (or dash if not assigned) |
| Regs | Registration count — zero counts are shown in light grey |
Upcoming Events
A separate table showing the next 10 upcoming events (those with a start date in the future) along with their current registration counts. This gives a forward-looking view of event participation.
| Column | Description |
|---|---|
| Event | Event name |
| Date | Event start date |
| Group | Church group associated with the event (or dash if none) |
| Regs | Current registration count |
Data Quality Admin
The Data Quality tab is a diagnostic tool that automatically scans your database for common data issues. Each check produces a count and a severity badge, making it easy to spot problems at a glance. Non-zero rows are clickable — clicking drills down to the relevant page with the appropriate filter pre-applied.
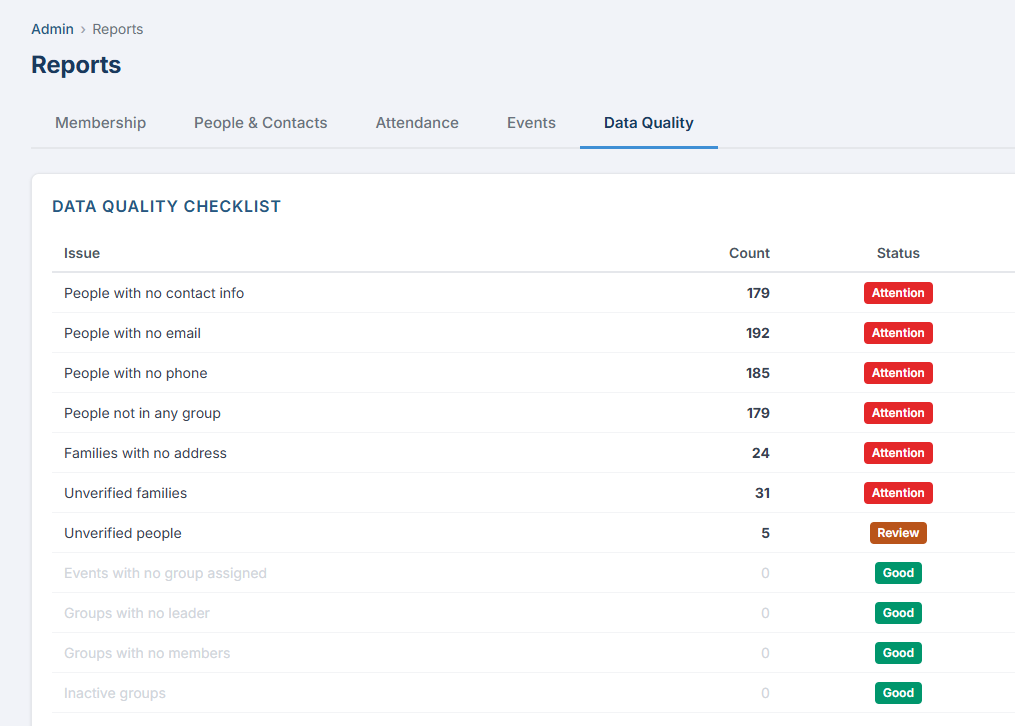
The Data Quality tab — 11 automated checks with color-coded severity badges and clickable drill-down rows.
Status Badges
Each data quality check displays one of three severity badges based on its count:
| Badge | Count Range | Meaning |
|---|---|---|
| Good | 0 | No issues found. The row is displayed in a muted style. |
| Review | 1 – 10 | A small number of issues exist. Worth reviewing when convenient. |
| Attention | More than 10 | Significant issues that should be addressed. The count is shown in bold. |
Data Quality Checks
The checklist evaluates 11 conditions across people, families, events, and groups:
| # | Issue | What It Checks | Drill-Down Target |
|---|---|---|---|
| 1 | People with no contact info | People who have neither an email address nor a phone number | People page with ?filter=no-contact |
| 2 | People with no email | People who have no email address in person_emails | People page with ?filter=no-email |
| 3 | People with no phone | People who have no phone number in person_phones | People page with ?filter=no-phone |
| 4 | People not in any group | People who are not members of any church group | People page with ?filter=no-group |
| 5 | Families with no address | Families that have no address recorded | People page with ?filter=no-address |
| 6 | Unverified families | Families where is_verified = false |
Families page — activates the Admin Verification flow (sets sessionStorage.verifyMode = true) |
| 7 | Unverified people | People where is_verified = false |
People page with ?filter=unverified |
| 8 | Events with no group assigned | Events that are not linked to any church group | Events admin page with ?filter=no-group |
| 9 | Groups with no leader | Church groups that have members but no designated leader | Church Groups page with ?filter=no-leader |
| 10 | Groups with no members | Church groups with zero active memberships | Church Groups page with ?filter=no-members |
| 11 | Inactive groups | Church groups where is_active = false |
Church Groups page with ?filter=inactive |
Drill-Down Behavior
When you click on a non-zero row in the Data Quality checklist, the system navigates directly to the relevant management page with a filter query parameter applied. This pre-filters the list to show only the affected records, allowing you to address issues immediately without manual searching.
- Open the Data Quality tab on the Reports page.
- Scan the checklist for rows with Review or Attention badges.
- Click any non-zero row. The right-arrow indicator ( → ) confirms the row is clickable.
- You are navigated to the relevant page with the appropriate filter active. For example, clicking "People with no email" opens the People page showing only people without an email address.
- Address the issues by editing the displayed records, then return to Reports to verify the count has decreased.
Special Case: Unverified Families
The "Unverified families" row has a unique drill-down behavior. Instead of applying a simple URL filter, it activates the Admin Verification flow by setting sessionStorage.verifyMode = true before navigating to the Families page. This starts the step-through verification process where you review and verify families one at a time.